[SQL] 기본문법과 응용예제
Tables and Basic Queries
행: observations (또는 items, records)
열: variables (또는 attributes)
import sqlite3 as db
conn = db.connect('example.db')  # database 연결
c = conn.cursor()  # 명령실행 위한 cursor()를 c로 임의 저장
c.execute("DROP TABLE IF EXISTS Students")  # 이미 존재하는 'Student' 테이블있다면 삭제
c.execute("CREATE TABLE Students (id INTEGER, name TEXT)") # 2개 열 가진 테이블생성
<sqlite3.Cursor at 0x2894e350880>
INSERT INTO
item 추가
c.execute("INSERT INTO Students VALUES (02, 'Andy')")
c.execute("INSERT INTO Students VALUES (09, 'Bill')")
c.execute("INSERT INTO Students VALUES (11, 'Chris')")
c.execute("INSERT INTO Students VALUES (13, 'Dan')")
<sqlite3.Cursor at 0x2894e350880>
excutemany()
item 추가
# 튜플 리스트로 추가하기
add_students = [(14, 'Ethan'),
                 (22, 'Frank'),
                 (31, 'Gavin'),
                 (37, 'Henry'),
                 (42, 'James')]

c.executemany('INSERT INTO Students VALUES (?, ?)', add_students)
conn.commit()  # 변경내용을 database에 반영하겠다고 확정하는 명령어
SELECT
조회
c.execute("SELECT * FROM Students")
results = c.fetchall()
print("\nThe entries of Students:\n", results, "Results:", len(results))
The entries of Students:
 [(2, 'Andy'), (9, 'Bill'), (11, 'Chris'), (13, 'Dan'), (14, 'Ethan'), (22, 'Frank'), (31, 'Gavin'), (37, 'Henry'), (42, 'James')] Results: 9
Join
INNER JOIN(A, B) A와 B 교집합
OUTER JOIN(A, B) A와 B 합집합 (missing value는 Null/SQL, NaN/Pandas로 채움)
LEFT JOIN(A, B) A 기준
RIGHT JOIN(A, B) B 기준
Where
조건
# Grades테이블 생성
c.execute('DROP TABLE IF EXISTS Grades')
c.execute('CREATE TABLE Grades (id INTEGER, course TEXT, grade REAL)')

add_items = [(9, "Arts", 4.0),
           (9, "Ethics", 3.0),
           (9, "History", 1.0),
           (13, "Arts", 4.0),
           (13, "Ethics", 4.0),
           (13, "History", 4.0),
           (31, "Arts", 2.0),
           (31, "History", 3.0)
           ]

c.executemany('INSERT INTO Grades VALUES (?, ?, ?)', add_items)
conn.commit()
# 예제: Grades테이블에서 id 대신 Students테이블의 name을 불러오시오
query = '''
        SELECT Students.name, Grades.course, Grades.grade
        FROM Students, Grades
        WHERE Students.id = Grades.id
'''

for match in c.execute(query):
    print(match)
('Bill', 'Arts', 4.0)
('Bill', 'Ethics', 3.0)
('Bill', 'History', 1.0)
('Dan', 'Arts', 4.0)
('Dan', 'Ethics', 4.0)
('Dan', 'History', 4.0)
('Gavin', 'Arts', 2.0)
('Gavin', 'History', 3.0)
# 예제: History과목의 (name, grade)으로 이루어진 리스트 생성하시오
query = '''
        SELECT Students.name, Grades.grade
        FROM Students, Grades
        WHERE Students.id = Grades.id and Grades.course = 'History'
'''
c.execute(query)
output = c.fetchall()
output
[('Bill', 1.0), ('Dan', 4.0), ('Gavin', 3.0)]
# 예제: Students테이블을 기준으로 LEFT JOIN하여 name, grade 선택하시오
query = '''
        SELECT Students.name, Grades.grade
        FROM Students LEFT JOIN Grades ON
        Students.id = Grades.id
'''
c.execute(query)
matches = c.fetchall()
for index, match in enumerate(matches):
    print(index, "=>", match)
0 => ('Andy', None)
1 => ('Bill', 1.0)
2 => ('Bill', 3.0)
3 => ('Bill', 4.0)
4 => ('Chris', None)
5 => ('Dan', 4.0)
6 => ('Dan', 4.0)
7 => ('Dan', 4.0)
8 => ('Ethan', None)
9 => ('Frank', None)
10 => ('Gavin', 2.0)
11 => ('Gavin', 3.0)
12 => ('Henry', None)
13 => ('James', None)
Aggregations (그룹별 계산)
AVG MIN MAX SUM COUNT
# id별로 평균 grade 계산
query = '''
        SELECT id, AVG(grade)
        FROM Grades
        GROUP BY id
'''
for match in c.execute(query):
    print(match)
(9, 2.6666666666666665)
(13, 4.0)
(31, 2.5)
Clean up
cursor, connection 닫기
c.close()
conn.close()
Data setup
참고 데이터: NYC 311 calls (datasets of complaints filed by residents of New York City via 311 calls)
dataset = db.connect("C:/Users/NYC-311-2M.db", isolation_level=None) # DB파일 생성 및 연결
LIMIT
부분 조회
query = '''
        SELECT * FROM data
        LIMIT 4
'''                             # 4개 행만 불러오기
import pandas as pd
df = pd.read_sql_query(query, dataset)
df.head()
| index | CreatedDate | ClosedDate | Agency | ComplaintType | Descriptor | City | |
|---|---|---|---|---|---|---|---|
| 0 | 1 | 2015-09-15 02:14:04.000000 | None | NYPD | Illegal Parking | Blocked Hydrant | None |
| 1 | 2 | 2015-09-15 02:12:49.000000 | None | NYPD | Noise - Street/Sidewalk | Loud Talking | NEW YORK |
| 2 | 3 | 2015-09-15 02:11:19.000000 | None | NYPD | Noise - Street/Sidewalk | Loud Talking | NEW YORK |
| 3 | 4 | 2015-09-15 02:09:46.000000 | None | NYPD | Noise - Commercial | Loud Talking | BRONX |
DISTINCT
unique value 찾기 (고유값)
query = 'SELECT DISTINCT Agency FROM data'
df = pd.read_sql_query(query, dataset)

print("Found {} unique Agencies. The first few are:".format(len(df)))
df.head()
Found 50 unique Agencies. The first few are:
| Agency | |
|---|---|
| 0 | NYPD |
| 1 | DHS |
| 2 | DOT |
| 3 | DOHMH |
| 4 | CHALL |
GROUP BY
그룹핑
# ComplaintType별로 묶기
query = '''
    SELECT ComplaintType, City, Agency
    FROM data
    GROUP BY ComplaintType
'''
df = pd.read_sql_query(query, dataset)
print(df.shape)
df.head()
(200, 3)
| ComplaintType | City | Agency | |
|---|---|---|---|
| 0 | AGENCY | BRONX | HPD |
| 1 | APPLIANCE | BRONX | HPD |
| 2 | Adopt-A-Basket | Springfield Gardens | DSNY |
| 3 | Agency Issues | None | DOT |
| 4 | Air Quality | NEW YORK | DEP |
그룹별 집합/계산
# ComplaintType별로 카운트한 7개 결과 출력
query = '''
    SELECT ComplaintType, COUNT(*)
    FROM data
    GROUP BY ComplaintType
    LIMIT 7
'''

df = pd.read_sql_query(query, dataset)
df
| ComplaintType | COUNT(*) | |
|---|---|---|
| 0 | AGENCY | 2 |
| 1 | APPLIANCE | 11263 |
| 2 | Adopt-A-Basket | 50 |
| 3 | Agency Issues | 7428 |
| 4 | Air Quality | 8151 |
| 5 | Animal Abuse | 10614 |
| 6 | Animal Facility - No Permit | 78 |
UPPER(), LOWER()
대문자/소문자/혼합형 변경
query = '''
    SELECT UPPER(Agency), LOWER(ComplaintType), LOWER(Descriptor)
    FROM data
    GROUP BY LOWER(ComplaintType)
    LIMIT 10
'''

df = pd.read_sql_query(query, dataset)
df.head()
| UPPER(Agency) | LOWER(ComplaintType) | LOWER(Descriptor) | |
|---|---|---|---|
| 0 | DSNY | adopt-a-basket | 10a adopt-a-basket |
| 1 | HPD | agency | housing quality standards |
| 2 | DOT | agency issues | bike share |
| 3 | DEP | air quality | air: odor/fumes, vehicle idling (ad3) |
| 4 | NYPD | animal abuse | other (complaint details) |
HAVING
그룹화된 필드에 조건을 줄 때
WHERE 기본적인 조건절로서 그룹핑 전 모든 필드에 조건 줄 수 있음
# 혼합형과 대소문자 중복
query1 = '''
      SELECT ComplaintType, COUNT(*)
      FROM (SELECT DISTINCT ComplaintType FROM data)
      GROUP BY LOWER(ComplaintType)
      HAVING COUNT(*) >= 2
'''
df1 = pd.read_sql_query(query1, dataset)
df1
| ComplaintType | COUNT(*) | |
|---|---|---|
| 0 | Elevator | 2 |
| 1 | PLUMBING | 2 |
IN
특정한 레코드 값 가져올때
query = '''
      SELECT DISTINCT ComplaintType
      FROM data
      WHERE LOWER(ComplaintType) IN ("plumbing", "elevator")
'''
df = pd.read_sql_query(query, dataset)
df.head()
| ComplaintType | |
|---|---|
| 0 | PLUMBING |
| 1 | Elevator |
| 2 | Plumbing |
| 3 | ELEVATOR |
AS
테이블 열 이름변경
query = '''
    SELECT Agency AS AGC, COUNT(*) AS NumComp
    FROM data
    GROUP BY Agency
'''
df = pd.read_sql_query(query, dataset)
df.head()
| AGC | NumComp | |
|---|---|---|
| 0 | 3-1-1 | 1289 |
| 1 | ACS | 3 |
| 2 | AJC | 6 |
| 3 | CAU | 1 |
| 4 | CCRB | 1 |
ORDER BY
정렬 (내림차순 -, DESC 사용)
query = '''
    SELECT Agency AS AGC, COUNT(*) AS NumComp
    FROM data
    GROUP BY UPPER(Agency)
    ORDER BY -NumComp
'''
# 또는 ORDER BY NumComplaints DESC

df = pd.read_sql_query(query, dataset)
df.head()
| AGC | NumComp | |
|---|---|---|
| 0 | HPD | 640096 |
| 1 | NYPD | 340694 |
| 2 | DOT | 322969 |
| 3 | DEP | 181121 |
| 4 | DSNY | 152004 |
LIKE %word%
word가 포함된 value값을 모두 조회
query = '''
    SELECT LOWER(ComplaintType) AS type, COUNT(*) AS freq
    FROM data
    WHERE LOWER(ComplaintType) LIKE '%noise%'
    GROUP BY type
    ORDER BY -freq'''

df_noisy = pd.read_sql_query(query, dataset)
print("'noise' 포함된 {}개 쿼리".format(len(df_noisy)))
df_noisy
'noise' 포함된 8개 쿼리
| type | freq | |
|---|---|---|
| 0 | noise | 54165 |
| 1 | noise - street/sidewalk | 48436 |
| 2 | noise - commercial | 42422 |
| 3 | noise - vehicle | 18370 |
| 4 | noise - park | 4020 |
| 5 | noise - helicopter | 1715 |
| 6 | noise - house of worship | 1143 |
| 7 | collection truck noise | 184 |
<> 특정 레코드값 제외
COLLATE NOCASE
대소문자 구분을 무시
# name = 'None'을 제외하고 City이름은 대소문자 구별하지 않음
query = '''
    SELECT UPPER(City) AS name, COUNT(*) AS freq
    FROM data
    WHERE name <> 'None'
    GROUP BY City COLLATE NOCASE
    ORDER BY -freq
    LIMIT 10
'''
df2 = pd.read_sql_query(query, dataset)
df2
| name | freq | |
|---|---|---|
| 0 | BROOKLYN | 579363 |
| 1 | NEW YORK | 385655 |
| 2 | BRONX | 342533 |
| 3 | STATEN ISLAND | 92509 |
| 4 | JAMAICA | 46683 |
| 5 | FLUSHING | 35504 |
| 6 | ASTORIA | 31873 |
| 7 | RIDGEWOOD | 21618 |
| 8 | WOODSIDE | 15932 |
| 9 | CORONA | 15740 |
top5_cities = list(df2.head(5)['name'])
top5_cities   # complaint 숫자로 본 top5 도시
['BROOKLYN', 'NEW YORK', 'BRONX', 'STATEN ISLAND', 'JAMAICA']
문자들의 list를 하나의 문자로
def strs_to_args(str_list):
    assert type (str_list) is list
    assert all ([type (s) is str for s in str_list])
    ###
    c = str(list(i for i in str_list))
    c= c.replace('[','')
    c= c.replace(']','')
    c= c.replace("'",'"')
    return c

# 테스트
a=['a', 'b', 'c', 'd']
strs_to_args(a)
'"a", "b", "c", "d"'
#예제: top5 도시들의 complaint type별 count를 구하시오
query = '''SELECT LOWER(ComplaintType) AS complaint_type,
                UPPER(CITY) as city_name, COUNT(*) as complaint_count
            FROM data
            WHERE city_name IN ({})
            GROUP BY city_name, complaint_type
'''.format(strs_to_args(top5_cities))

df_complaints_by_city = pd.read_sql_query(query, dataset)
df_complaints_by_city
###
display(df_complaints_by_city.head(10))
| complaint_type | city_name | complaint_count | |
|---|---|---|---|
| 0 | adopt-a-basket | BRONX | 7 |
| 1 | agency | BRONX | 1 |
| 2 | air quality | BRONX | 666 |
| 3 | animal abuse | BRONX | 1973 |
| 4 | animal facility - no permit | BRONX | 10 |
| 5 | animal in a park | BRONX | 189 |
| 6 | appliance | BRONX | 3758 |
| 7 | asbestos | BRONX | 264 |
| 8 | beach/pool/sauna complaint | BRONX | 13 |
| 9 | best/site safety | BRONX | 22 |
# 예제: 전체도시에서 top10 complaints를 정렬
query = '''Select LOWER(ComplaintType) as type, Count(ComplaintType) as freq
           from data GROUP BY type
           ORDER BY -freq
            '''
df_complaint_freq = pd.read_sql_query(query, dataset)
top_complaints = df_complaint_freq[:10]
top_complaints
| type | freq | |
|---|---|---|
| 0 | heat/hot water | 241430 |
| 1 | street condition | 124347 |
| 2 | street light condition | 98577 |
| 3 | blocked driveway | 95080 |
| 4 | illegal parking | 83961 |
| 5 | unsanitary condition | 81394 |
| 6 | paint/plaster | 69929 |
| 7 | water system | 69209 |
| 8 | plumbing | 60105 |
| 9 | noise | 54165 |
# 도시별 top10 complaints별 count
df_plot = top_complaints.merge(df_complaints_by_city,
                               left_on=['type'],
                               right_on=['complaint_type'],
                               how='left')
df_plot.dropna(inplace=True)
df_plot.head(3)
| type | freq | complaint_type | city_name | complaint_count | |
|---|---|---|---|---|---|
| 0 | heat/hot water | 241430 | heat/hot water | BRONX | 79690 |
| 1 | heat/hot water | 241430 | heat/hot water | BROOKLYN | 72410 |
| 2 | heat/hot water | 241430 | heat/hot water | JAMAICA | 3376 |
# 예제: 도시별 전체 불만 중 해당 불만이 차지하는 비중을 'frac'으로 나타내라
df_plot['frac']=df_plot['complaint_count']/df_plot['freq']  # 열 추가
df_plot_fraction = df_plot.copy()  # DF 복사
df_plot_fraction = df_plot.drop('complaint_count', axis=1)  # 'count'열 삭제
###
df_plot_fraction.head(2)
| type | freq | complaint_type | city_name | frac | |
|---|---|---|---|---|---|
| 0 | heat/hot water | 241430 | heat/hot water | BRONX | 0.330075 |
| 1 | heat/hot water | 241430 | heat/hot water | BROOKLYN | 0.299921 |
날짜, 시간
query = '''
        SELECT LOWER(ComplaintType), CreatedDate, UPPER(City)
        FROM data
        WHERE CreatedDate >= "2015-09-15 00:00:00.0"
        and CreatedDate < "2015-09-16 00:00:00.0"
        ORDER BY CreatedDate
'''    # 2015-09-15 ~ 2015-09-16 날짜 사이 발생한 items 모두
df = pd.read_sql_query (query, dataset)
df.head(2)
| LOWER(ComplaintType) | CreatedDate | UPPER(City) | |
|---|---|---|---|
| 0 | illegal parking | 2015-09-15 00:01:23.000000 | None |
| 1 | blocked driveway | 2015-09-15 00:02:29.000000 | REGO PARK |
strftime()
날짜/시간을 string으로 변환
query = '''
    SELECT CreatedDate, STRFTIME('%H', CreatedDate) AS Hour, LOWER(ComplaintType)
    FROM data
    LIMIT 5
'''    # 시간을 Hour로 저장
df = pd.read_sql_query (query, dataset)
df.head(2)
| CreatedDate | Hour | LOWER(ComplaintType) | |
|---|---|---|---|
| 0 | 2015-09-15 02:14:04.000000 | 02 | illegal parking |
| 1 | 2015-09-15 02:12:49.000000 | 02 | noise - street/sidewalk |
# 예제: 시간대별 count 구하기
query = '''
    SELECT STRFTIME('%H', CreatedDate) AS hour, count(*) AS count
    FROM data GROUP BY hour'''
df_complaints_by_hour = pd.read_sql_query(query, dataset)
###
df_complaints_by_hour.head(2)
| hour | count | |
|---|---|---|
| 0 | 00 | 564703 |
| 1 | 01 | 23489 |
# 예제: noise들어간 compalint type중에 00:00시 날짜를 제외하고 시간대별 정렬
query='''SELECT STRFTIME('%H', CreatedDate) AS hour, count(*) AS count
         FROM data
         WHERE LOWER(ComplaintType) LIKE '%noise%' AND
         STRFTIME('%H:%M:%f', CreatedDate) <> '00:00:00.000'
         GROUP BY hour
'''
df_noisy_by_hour = pd.read_sql_query(query, dataset)
df_noisy_by_hour.head(3)
| hour | count | |
|---|---|---|
| 0 | 00 | 15349 |
| 1 | 01 | 11284 |
| 2 | 02 | 7170 |
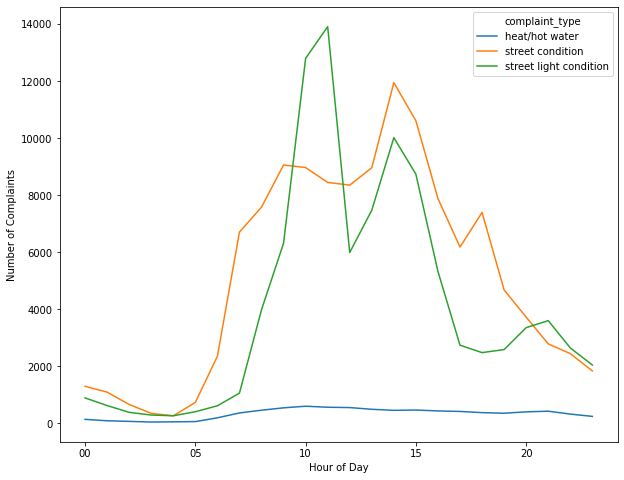
# 예제: top3 complaint를 시간대별로, count 역순 정렬
top3 = strs_to_args(top_complaints[:3]['type'].tolist())

query='''
    SELECT LOWER(ComplaintType) as complaint_type, strftime('%H', CreatedDate) as hour, count(*) as count
    FROM data
    WHERE (complaint_type IN ({}) and strftime('%H:%M:%f', CreatedDate)<> '00:00:00.000')
    GROUP BY complaint_type, hour
    ORDER BY hour, -count
'''.format(top3)

df_top3_complaints_by_hour = pd.read_sql_query(query, dataset)
df_top3_complaints_by_hour.head(10)
| complaint_type | hour | count | |
|---|---|---|---|
| 0 | street condition | 00 | 1298 |
| 1 | street light condition | 00 | 891 |
| 2 | heat/hot water | 00 | 139 |
| 3 | street condition | 01 | 1093 |
| 4 | street light condition | 01 | 623 |
| 5 | heat/hot water | 01 | 89 |
| 6 | street condition | 02 | 661 |
| 7 | street light condition | 02 | 385 |
| 8 | heat/hot water | 02 | 68 |
| 9 | street condition | 03 | 349 |
# 시간대별 complaint 수를 line chart로 그리시오
df_pivot = pd.pivot_table(df_top3_complaints_by_hour, values='count', columns='complaint_type', index='hour')

import matplotlib.pyplot as plt
df_pivot.plot(figsize=(10, 8))
plt.xlabel('Hour of Day')
plt.ylabel('Number of Complaints')
plt.show()